Hurricanes and Tornadoes in Your Financial World

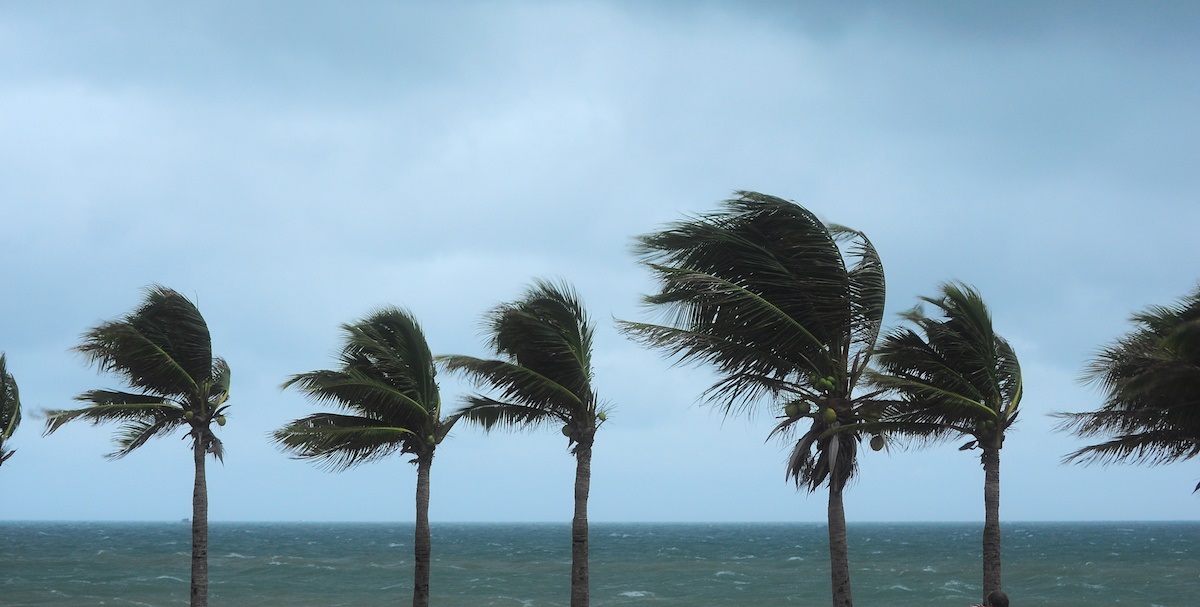
My wife, Sandy, and I sat huddled in the dark; the wind outside howled as if a freight train was going by. It was the fall of 1984, our first hurricane experience in Wilmington. Hurricane Diana raged outside for two days; it was the first major hurricane to hit the U.S. East Coast in nearly 20 years. Sandy and I made all the classic preparations: uselessly taping masking tape to all the windows and stocking up on water, batteries, bread, ice and — of course — beer. We had plenty of advance warning because, even 30+ years ago, there were satellites, radar, airplanes, weather buoys and other means of assessing and informing us of a potential crisis.
Tornadoes are very different. With a tornado, you have just a few short minutes of notice.
The stock market is also subject to what we might call “financial hurricanes and tornadoes.” Stock market “tornadoes” don’t give us much warning either — 9/11 caused a financial tornado of record declines in the market. It’s difficult, if not impossible, to prepare for something we don’t see coming.
“Financial hurricanes” also hit the financial markets on a fairly regular basis, just like the ones hitting our coast. Typically, the market keeps going up and up. People keep investing until the price of stocks gets so high they are overvalued. Then, we have a market “hurricane” where the prices drop, sometimes rapidly.
Just like the weather-driven hurricanes, there may be indications that the storm is coming. They aren’t necessarily as accurate as our weather satellites, but they can tell us when a potential financial hurricane is looming.
One such financial hurricane indicator was developed by Robert Schiller. Let me tell you why you might want to pay attention to Schiller’s indicator: Robert has a Ph.D. from MIT; he taught at the Wharton School before moving to his current professorship at Yale, and in 2013 he won the Nobel Prize in Economics. Many people know him best for a book he first published in 2000 called Irrational Exuberance, which demonstrated how the stock markets were overvalued. The stock market collapse of 2000 occurred in the exact month of the book’s publication.
To come up with a good forecasting tool, Schiller developed a more advanced version of the “PE ratio,” which stands for Price/Earnings, the price of a stock divided by the company’s earnings. A simplified explanation might go like this: If you bought a stock for $10 a share and it paid you $1 each year, it would take 10 years to earn back the money you spent to buy the stock. The PE ratio for that stock would be 10. Schiller refined it by averaging earnings over the last 10 years to make it less sensitive to short-term changes.
Over time, the average PE ratio has been 16; currently, the ratio is 29. Running this Schiller index over the past 136 years of stock market history, we find that there were only four times when the index was above 25. Those were: 1929, 1999, 2007 and today. You probably can recall that, in the case of the first three, the market crashed soon afterward.
Does this mean we are set for a crash? Again, the stock market is harder to predict than the weather, but this Schiller ratio does suggest that a financial hurricane may be approaching, still not yet visible over the horizon.
When a real hurricane is approaching, there are steps to take in preparation, such as boarding up the windows, stocking up on water and installing a separate generator. You can also make preparations for a financial hurricane. There are several programs that can look at your portfolio and predict how it might behave under certain market conditions; these programs can be used to measure how “hurricane proof” your current investments are. If the risk looks too great, you can seek less risky solutions.
Would you like to be more proactive about making financial hurricane preparations? We would like to extend a special offer to our blog readers — let us help you determine where you stand now and whether you are in a position to weather the storm. After discussing your situation and assessing your risk comfort level, we will run your portfolio through two different analyzers. Once we go over the results, you will have a better feel for the damage your investments might suffer should the next financial hurricane be upon us.
There is no cost or obligation for this analysis. Why are we making this offer? It’s a way to introduce ourselves. Some people will find that they are well prepared, and this analysis will be all that they need. Others may find that there are areas they need to address or would like to get a more thorough second opinion on their retirement plans.
So, if you are concerned that your portfolio might not be ready for a storm, call our office 910-815-3100 and arrange a visit for your analysis. Ask, too, about the retirement planning course we host at colleges and universities in the area.
Contributing author AES Virtual Consulting
References:
https://en.wikipedia.org/wiki/Hurricane_Diana_(1984)
http://www.investopedia.com/financial-edge/0911/how-september-11-affected-the-u.s.-stock-market.aspx
https://en.wikipedia.org/wiki/Robert_J._Shiller
https://en.wikipedia.org/wiki/Cyclically_adjusted_price-to-earnings_ratio
Investment advisory services offered only by duly registered individuals through AE Wealth Management, LLC (AEWM). AEWM and Carolina Retirement Planners, LLC are not affiliated companies. Investing involves risk, including the potential loss of principal. Any references to protection benefits and lifetime income generally refer to fixed insurance products, never securities or investment products. Insurance and annuity product guarantees are backed by the financial strength and claims-paying ability of the issuing insurance company.

